2023 Market Outlook

A Pinch of Salt
nAh yes, the mind-bendingly difficult task of predicting exactly what will happen in the year ahead has rolled around once more.
Understandably, everyone is searching for that sense of conviction that comes with having a clear vision of the future.
Unfortunately, Investing is a game of probabilities, not certainties, so no such clarity exists.nNothing is ever guaranteed. Unknown unknowns lurk around every corner, and the game is always changing.
While you will never be able to predict precisely what’s going to happen, current data does shine a light on what lies ahead for markets in 2023.
With all this in mind, here is my view on the most probable direction for markets in 2023 and how to position your portfolio accordingly.
Don’t wait until the market has moved to put a plan in place.
Don’t Look Back in Anger
Investing is never about what has happened but what will happen next, so I will keep the recap short. Essentially, the story of the entire year was ‘The Fed vs. Inflation’.
Loose monetary policy and excessive liquidity to counteract the effects of the pandemic functioned as a catalyst for the highest inflation in 40 years. In response, the Fed rolled out the fastest set of interest rate increases ever.
The Fed’s Aggressive Policy
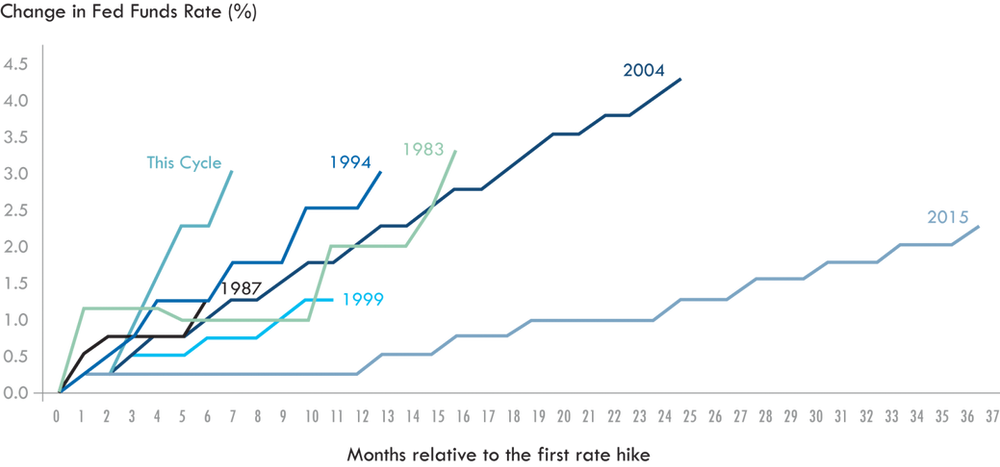
Source: Bloomberg
Equities and bonds declined in unison as higher rates, the war in Ukraine and a strong dollar ripped through markets, resulting in the third-worst year in history for balanced portfolios.
Portfolio Destruction
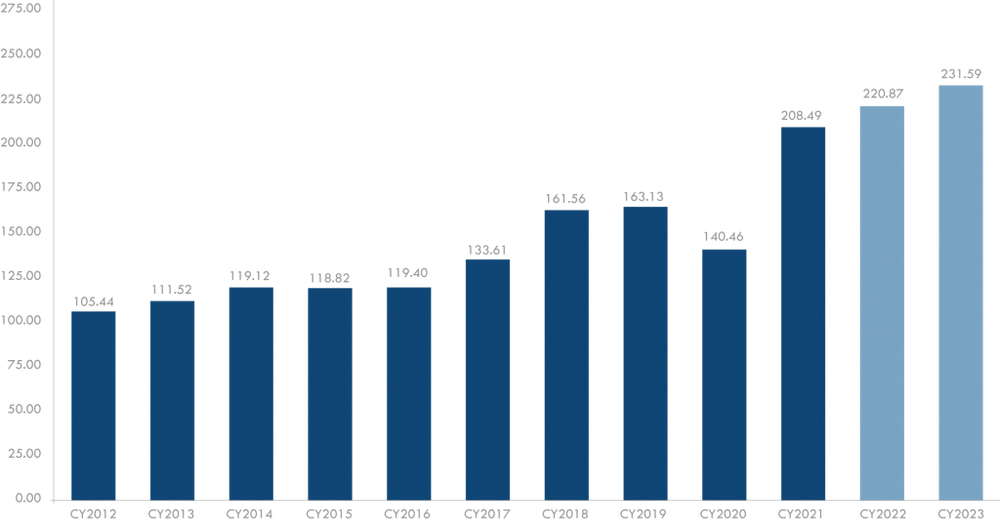
The S&P 500 finished the year down 19.4%. This makes 2022 the worst year for the S&P since 2008 and the fourth-worst year since the index’s launch in 1957.
Unfortunately, equity market woes were reciprocated by the bond market. The drawdown in the Bloomberg Barclays Global Bond Aggregate in the first 10 months of 2022 was around -20%, four times as bad as the previous worst year since records began in 1992.
The benchmark U.S. government bond Index fell more than 15% in 2022. To put this into context, there has only been one double-digit calendar year loss for 10-year U.S. treasuries since the 1920s. That was an 11.1% loss in 2009.
This combination of equity and bond losses makes 2022 a year to forget for many investors.
Stocks and Bonds Both Fell Double-Digits
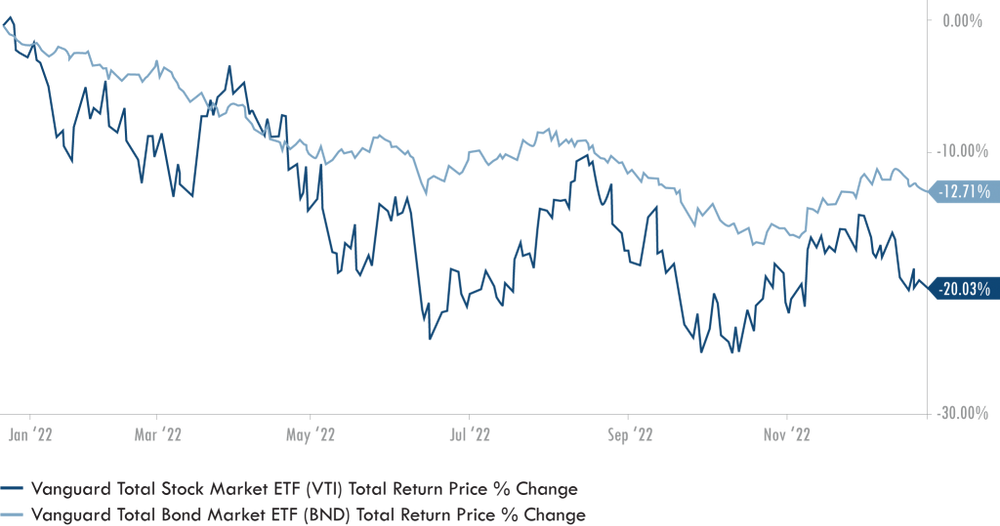
Source: Ycharts
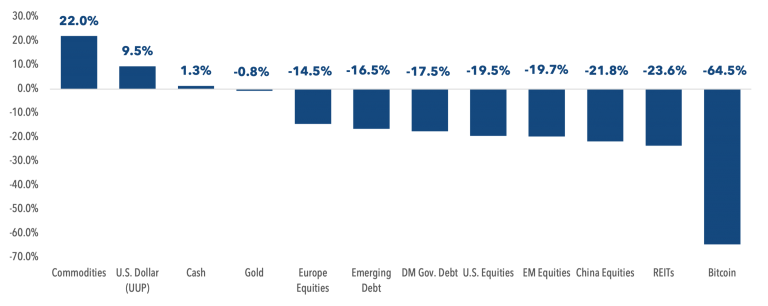
Asset Class Performance 2022
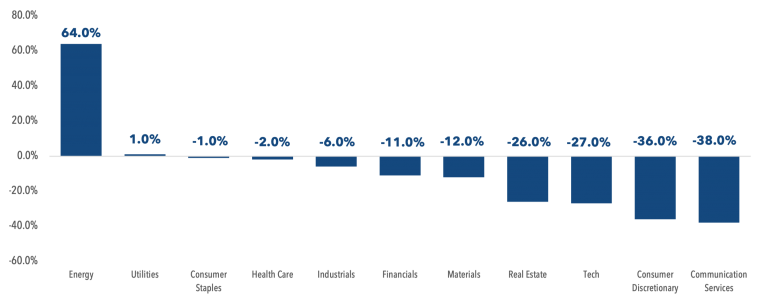
S&P 500 Sector Breakdown 2022
There is no denying it; the positives from 2022 are few and far between. The solitary silver lining is hidden in the new higher-rate environment we now find ourselves in.
After years of zero yield offerings, investors can now add yield to their portfolio without being forced out the risk curve.
nShort-to-intermediate-term bonds are now in the 4-5% range, while equity valuations have contracted sharply, bringing them back in line with long-term averages.
Despite the pain of 2022, investors’ ability to build diversified, income-generating portfolios is now the strongest it has been in over a decade.nWith that said, as we look ahead to 2023, the suffering might not be over just yet.
A GUARANTEED RECESSION
The consensus 2023 outlook from analysts and investment banks across Wall Street has been suspiciously uniform (always a red flag when the entire market agrees on something).
The general view sees the US economy going into a mild recession sometime in 2023.
Tighter fiscal policies will lead to lower nominal growth, reducing company earnings by roughly 10%. This earnings drawdown will lead to equities retesting their October lows in the first half of the year.
From there, lower Inflation numbers will allow the Fed to take their foot off the gas, with the FFR expected to peak around the 4.75% – 5.25% range.
This easing of monetary policy would then allow stocks to rebound.nPutting it all together, strategists expect a volatile first half to be followed by an easier second half, which could see stocks climb modestly higher by year-end.
While I am not entirely at odds with this view and agree with the timeline, I believe the fallout from a policy misstep may be more severe than what is currently priced in.
Tightening financial conditions into weaker fundamentals while ignoring all forward-looking indicators is a guaranteed way to stop inflation. However, I’m not sure replacing inflation with a recession is the answer we have all been looking for.
INFLATION OR RECESSION
The inflation of 2022 needs little introduction. It was everywhere. As if burning a hole in your pocket wasn’t enough, it incessantly occupied our tv screens and newspaper headlines.
As someone who chose 2022 as the year to travel around the world, I sat front row as the
inflation wrecking ball swung. Airline ticket prices and comical Airbnb rates have haunted my
every move.
My first-world problems aside, inflation peaked in June at 9.1%, a level not seen since the 1970s, a considerable reversal from what we had become accustomed to in recent times.
“Low inflation is indeed the problem of this era.”
– John Williams, president of the Federal Reserve Bank of New York, in late 2019
Since June, CPI figures have slowly tipped lower with the latest November reading coming in at 7.1% on a year-over-year basis. The smallest 12-month increase since December 2021.
US Inflation Rate Slows
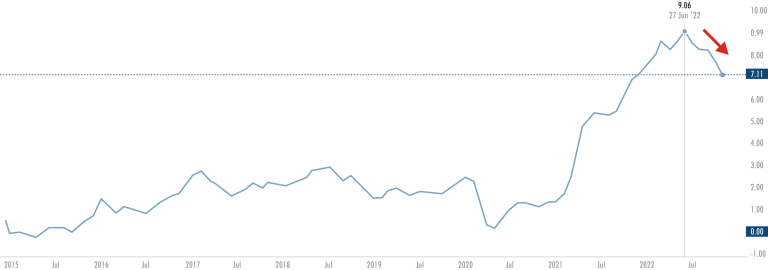
Source: TradingView
nUndoubtedly this is still high by historic norms and well above the Fed’s target rate of 2%, but when you dive a bit deeper into the recent data, the slowdown in inflation is a little more pronounced than the headline figures suggest.
While it is important to look at the year-over-year numbers, more weight must be placed on the most recent figures as this reveals the trend in the data.
When inflation is low and stable, monthly core inflation is roughly 0.2%. Core CPI rose 0.2% in November after a 0.3% reading in October.
One month doesn’t make a trend, or even two months, but the October and November readings are a big step in the right direction.
Core PCE is now 3.6% on an annualised basis over the last 3 months. That’s the lowest rise since February 2021.
The Breakdown
If you break it down further into inflation’s 3 major components (Goods, Services and Housing), the trend becomes even more apparent.
Core Goods: Spending continues to rotate from goods to services as travel replaces our amazon cart binges. This, combined with healing supply bottlenecks and a complete 180 in inventory levels, has started to put downward pressure on core goods inflation. A trend that is expected to continue
Shelter: Housing and rental prices have accounted for about half of the annual “core” inflation increase in 2022, but this has started to moderate somewhat. Private-sector rental data and the CPI shelter index suggest we may have reached a peak, but this will take a while to play out as rents on continuing leases roll over and catch up with current market rates.
MoM Change in National Rent Index (2018-Present)
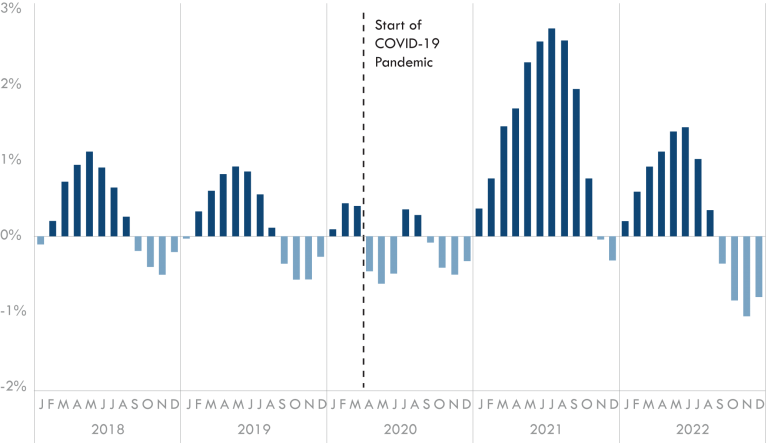
Source: ApartmentList
Core Services (Ex housing): This is where the Fed appears to be focusing the bulk of their attention as they attempt to slow down demand by weakening the labour market and lowering wage demands. The latest CPI print showed core services (ex-housing) pricing cooling further: its annualized 3-month rate of change is now rapidly dropping towards 2%.
So with the stickiest components of inflation now cooling off and leading indicators showing further signs of slowing, the ‘obvious’ next move for the Fed would be to pause right? Allowing the economy to adjust to this new higher rate environment seems reasonable, seeing as interest rate hikes have historically had a lag effect of up to 18 months.
But no.
Instead, The Fed re-emerged swinging, updating their economic projections with their Dot Plot showing the Fed Funds Rate at 5.125% by December 2023.
That’s right, more rate hikes.
Perhaps most alarming is where the Fed believes core PCE will be after a year of rates above 5%. Current projections show core PCE still at 3.5% by the end of 2023, essentially still in line with the current 3-month annualized rate.
In my view, rates above 5% for all of 2023 would have a far stronger dis-inflationary effect than the Feds projections suggest.
Excess spending is contracting sharply, both manufacturing and servicing PMI’s are signalling a cooling economy, financial conditions and bank lending standards have tightened very aggressively, and payroll growth remains on a downward trend.
Household Excess Savings are being eroded
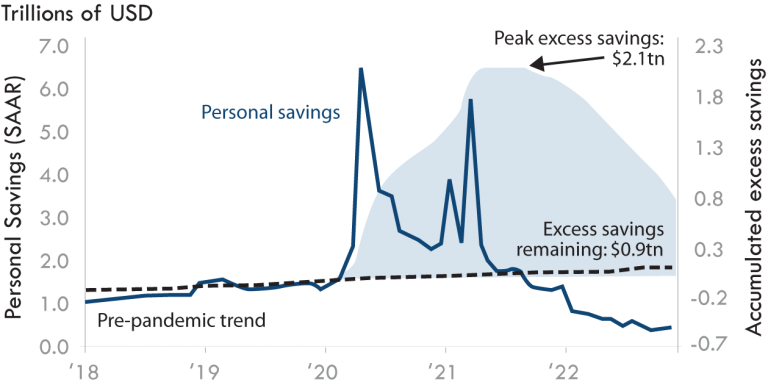
Source: JP Morgann
Latest ISM Manufacturing data shows Demand Continuing to Slow
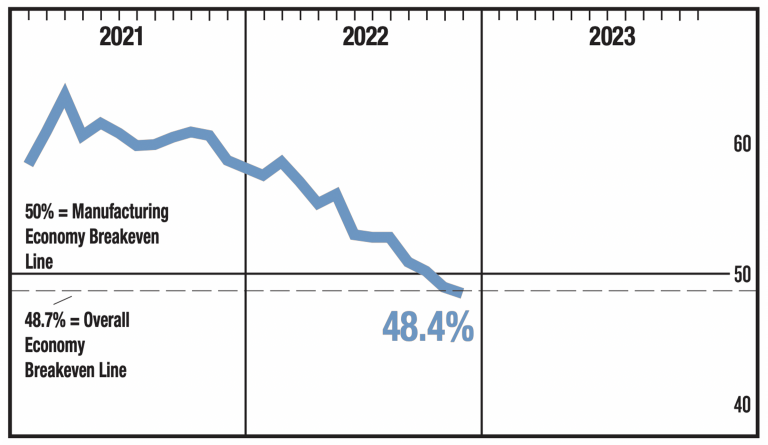
Source: ISM
The Same Trend can be Seen Across the Services Industry
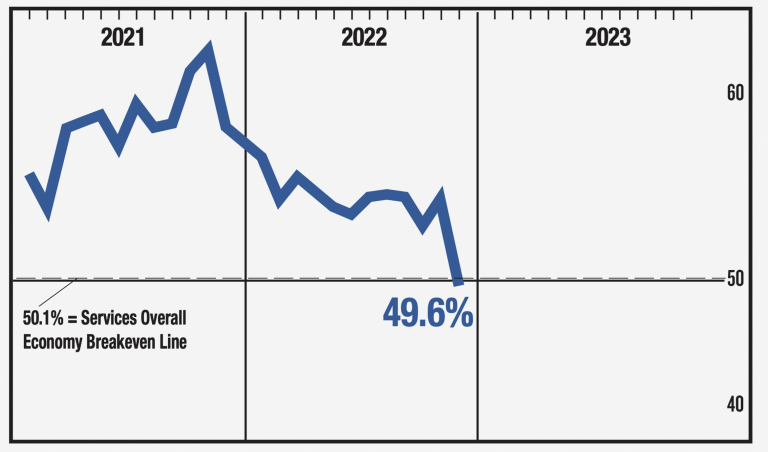
Source: ISM
Payroll enters a downward trend
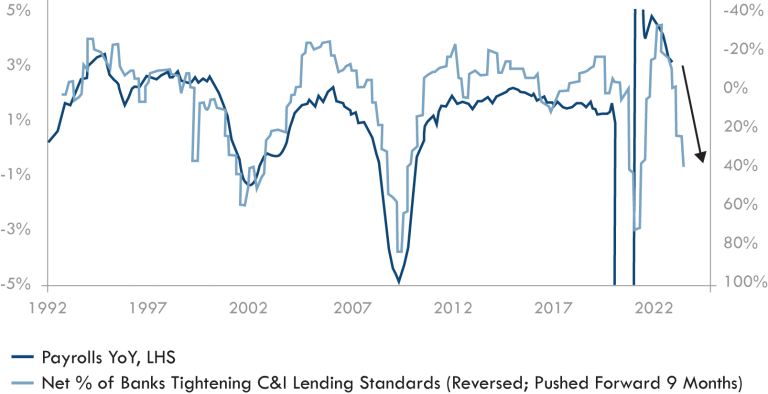
Source Bloomberg
The Fed’s track record of making accurate projections has always been questionable. In June 2021, the Fed was projecting a Fed Funds rate of 0.6% by 2023….. As the information changes, so too will the Feds’ projections.
At this point in the cycle, I see little chance of the Fed being able to keep rates above 5% for the entirety of 2023.
In short, disinflation and a Fed pivot are two areas that are currently seen as low-probability events but in my opinion, they are much more likely than the market is currently pricing in.
My view: Rates above 5% will lead to a painful Q2 2023 as earnings and nominal growth contract. This will force a necessary pivot from the Fed creating buying opportunities in equities that will have already front-run the economic contraction ahead.
Until then, the short end of the Treasury curve remains the safest harbour for investors.
What’s Priced in? (Hint: Overly Optimistic Earnings)
The equity story in 2022 can be summarized as a painful re-rating of valuations as a decade of free money was replaced by the fastest rate hike cycle in history.
In simple terms, when money is free, and governments are hell-bent on continuously printing more and more of it, asset prices increase. This money printing pushed prices and valuation multiples to questionable highs over recent years.
Policymakers have now gone from large fiscal injections to large fiscal withdrawals. The pendulum is swinging in the opposite direction, leaving us in a far less supportive environment and risk assets are being repriced accordingly.
The forward 12-month P/E ratio for the S&P 500 has fallen from over 30 in 2021 to 17.3. This P/E ratio is now below the 5-year average (18.5) but above the 10-year average (17.1).
Forward P/E Moves in Line with 10-Year Average
Source: Factset
This repricing has been entirely valuation driven as unsustainably high company valuations fell despite an increase in company earnings in 2022.
S&P 500: Source of the Price Change
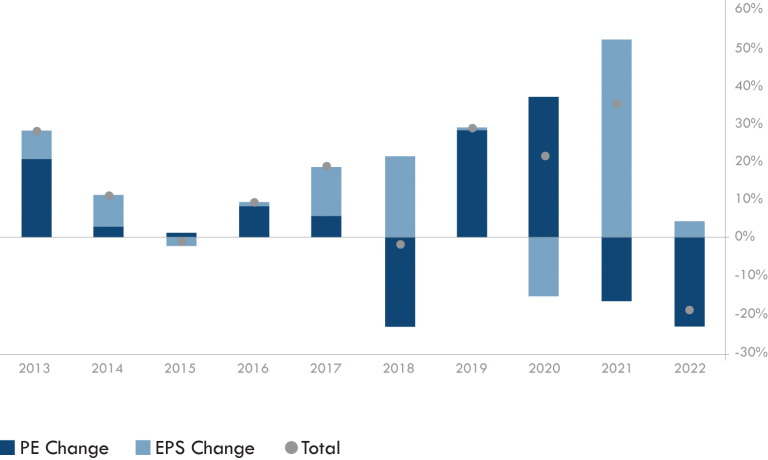
Source: The Compound
Of course, companies becoming cheaper while they make more money is an investor’s dream, but as always, there’s a catch. Yes, earnings have held up well this year, but they are expected to slow next year, and as a forward-looking machine, the market has discounted accordingly.nNow the question becomes, has all of this future earning decline already been priced in or is there further to fall?
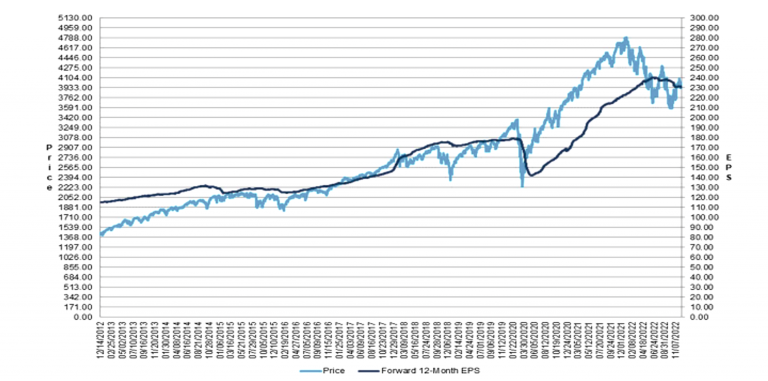
To answer this, we need to look at analysts’ expected earnings projections for 2023.nSurprisingly, despite months of downward revisions to expect earnings, they remain near record levels for 2023.
S&P 500 EPS Actuals & Estimates
Source: Factset
In my opinion, projections of 5% earnings growth against the backdrop of tighter monetary policy and weakening fundamentals are overly optimistic.
An earnings decline closer to 20% from the peak would seem more justifiable as we stare down the barrel of a slowing economy.
With that said, I believe that the market has already priced in some further downgrades to consensus forecasts, just maybe not enough.
In short, The repricing we’ve seen makes valuations look more attractive, but until earnings growth is downgraded sufficiently to reflect the new reality, volatility will remain.
Equity positioning
As with 2022, stocks which provide an attractive income appear more reasonably valued than those with little or no income.
Growth stocks still look expensive despite extensive pullbacks. But of course, a number of these high beta names will be the biggest winners if and when a Fed pivot materializes.nAny overall underweight to stocks in the first half of the year with a material tilt towards cash-flow-centric names should provide portfolio resilience.
More specifically, financials (NIM’s and balance sheet strength) and healthcare (ageing population demographics) are preferred from a sector standpoint, while LATAM and other emerging markets are offering some true out-performance potential for the first time in years.
The same applies to Developed markets Ex U.S. Since I started my career, the promise of other developed markets (U.K., Europe etc.) outperforming the U.S. was preached relentlessly given the strong mean reversion expectation following over a decade of out-performance in the U.S.
This never resonated with me. I have always remained 100% U.S. based until now, that is. Other developed markets don’t come without their flaws. Europe is deeply fragmented not only in a geo-political sense as a result of the war in Ukraine but also from a monetary and fiscal policy perspective but much of this low expectation is built into the price, with fundamentals now strong in relative terms. As we move back towards a market where value is more consistently rewarded and Dollar strength slips, D.M. ex U.S. positions could finally climb out of the growth shadow the U.S. has cast over the last decade.
It’s not all bad news. Much of the downside is already priced in and from a longer-term strategic standpoint, valuations are in a much stronger position relative to this time last year. Once the earnings decline is fully reflected, long-term opportunities will emerge for those ready and willing to put their money on the table.
Until then, tactically chose equity sectors that can survive a challenging economic environment.
Investment Ideas straight to your email: FREE
THE RETURN OF THE KING
The reports of my death have been greatly exaggerated
-Mark Twain
nAllocating to fixed income has been a thankless endeavour in recent years. Interest rates of close to zero meant bonds no longer offered diversification or income. Once the ballast in a balanced portfolio, bonds had been Rendered powerless by a 40-year precipitous decline in rates.
The 40 Year Decline in Interest Rates
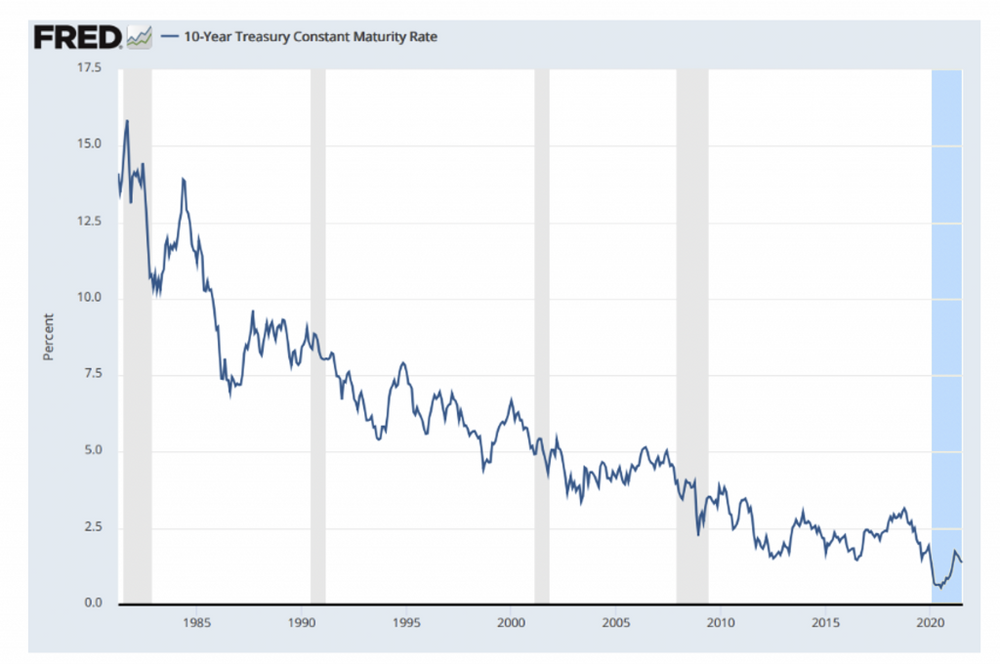
Source: Fed Reserve
At one point, a staggering 90% of the global government bond universe was offering interest rates of less than 1%, forcing investors to search for yield in more precarious places.
Thankfully, in 2022, surging inflation came to the rescue….
The brutal repricing that came as a result of the Feds efforts to tame the inflation beast have brought short term treasuries back to between 4% and 5%.
One-Year Treasury Rate Skyrockets
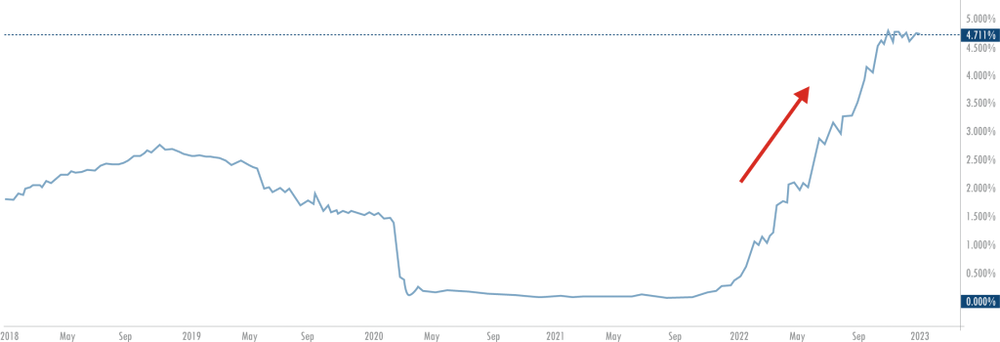
Source: TradingView
For the first time in a long time, the rotation into bonds is an attractive trade. For risk-averse savers, this is a game changer as the endless search for yield is over.
Granted, the 1% real yield on global government bonds may not sound particularly exciting, but it is the highest level since the financial crisis and around long-term averages.
On a relative basis, the S&P dividend yield is currently 2.5% while the 10-year treasury is roughly 3.5%, so you can now get more income from bonds than equities. A sharp reversal from recent years. The final cherry on top is the potential for yield contraction. For those, who, like me, question the probability of keeping rates above 5% against the backdrop of weaker nominal growth, there is the added bonus of enjoying relatively high coupon payments now and potentially selling at a premium as yields contract, and bond prices rise.
In short, investors now have several higher-yielding, lower-volatility alternatives if they want to step back from the market.
An opportunity that should be taken, given the risks/reward payoffs elsewhere.
Special Note
Risk-free treasuries offer 4.8%, while the US savings account rate for all financial institutions insured by the FDIC is 0.24%.
If you just have your money sitting in your banks deposit account, it’s time to seriously reconsider your choices.
1 Year Treasury Rate
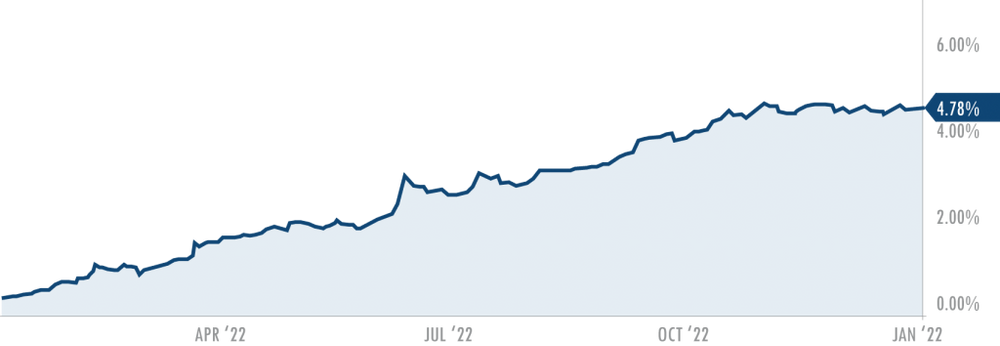
Source:Ycharts
US Savings Rate
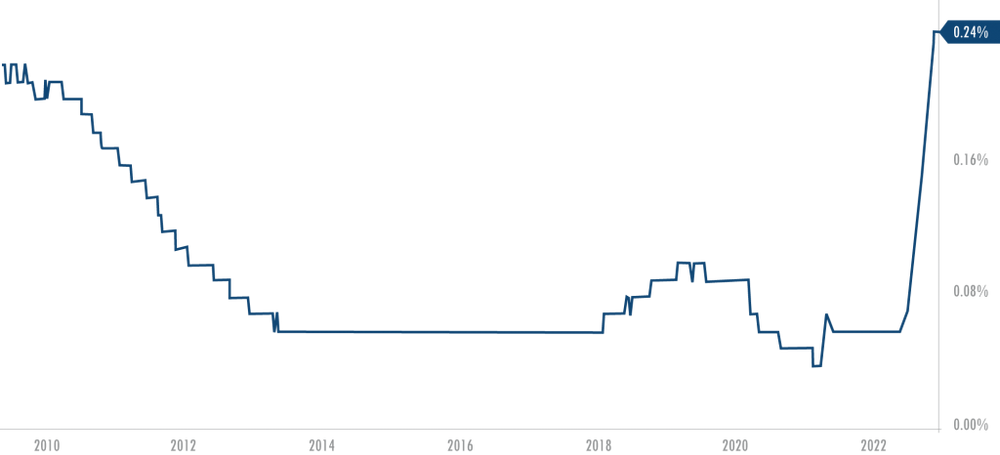
Source:Ycharts
Fixed Income Positioning
With the correction in the bond market near completion as the FFR approaches 5%, I am tactically overweight short-term government debt given the current yields and risk elsewhere.nThe case can also be made for a smaller allocation to investment-grade bonds. While the spreads remain narrow, many of these companies rebalanced at lower yields during the pandemic so their balance sheets can hold up in a recession.
I remain on the fence regarding the longer end of the curve. Higher rates on the short end of the curve has helped curb my appetite here. A fed pivot may provide upside potential as yields contract, but more compensation is needed to account for the term premium in my view.
Now is the perfect time to set up your strategic long-term investment plan
REAL ESTATE WOES
The ripple of weaker housing activity has already begun.
Existing home sales have dropped dramatically with November clocking the worst decline since February 2008 – down 28.4%
US Existing Homes Sales – YoY
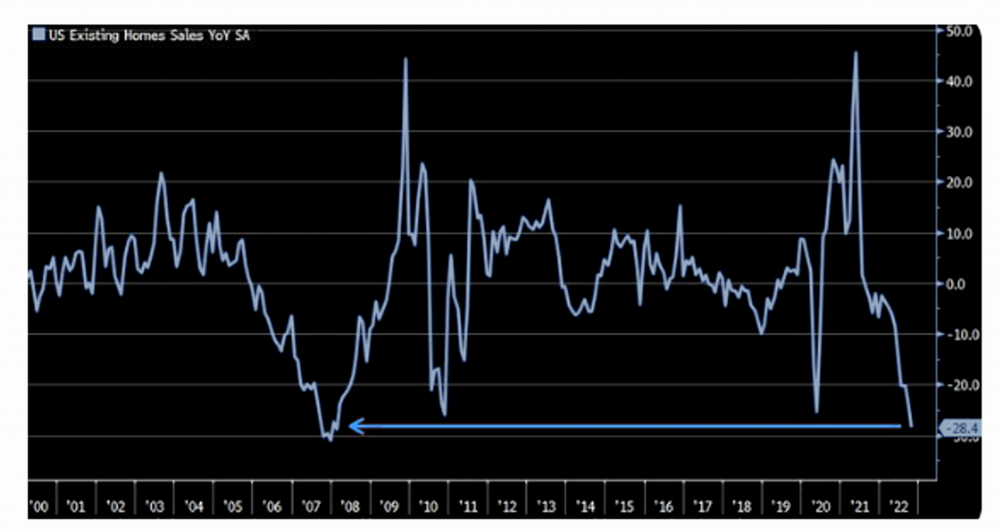
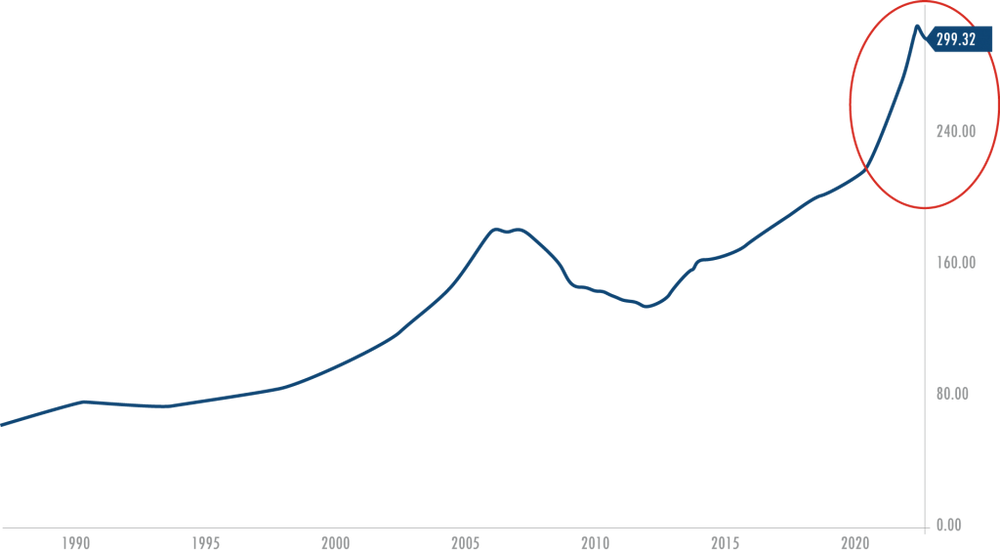
Source: Bloomberg/LizAnnSondersn nOn a monthly basis, house prices dropped 0.2% in November. Prices are now about 2.5% below their spring 2022 peak and are expected to continue.
US House Prices Fall from All Time Highs
Source:CalculatedRisk
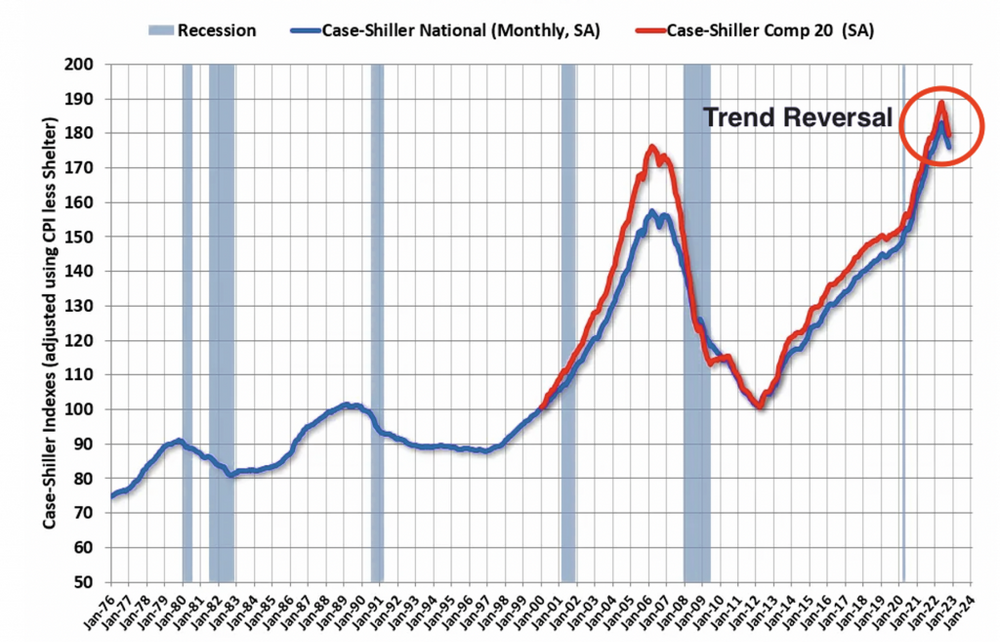
This is hardly surprising given that we condensed 10-years of growth into an 18-month period as house prices jumped 40% since 2020.
Case-Schiller Home Price Index
Source: Ychartsn nOnce you add the doubling of mortgage rates into this potent mix, you have a recipe for disaster.
US 30 Year Mortgage Rates
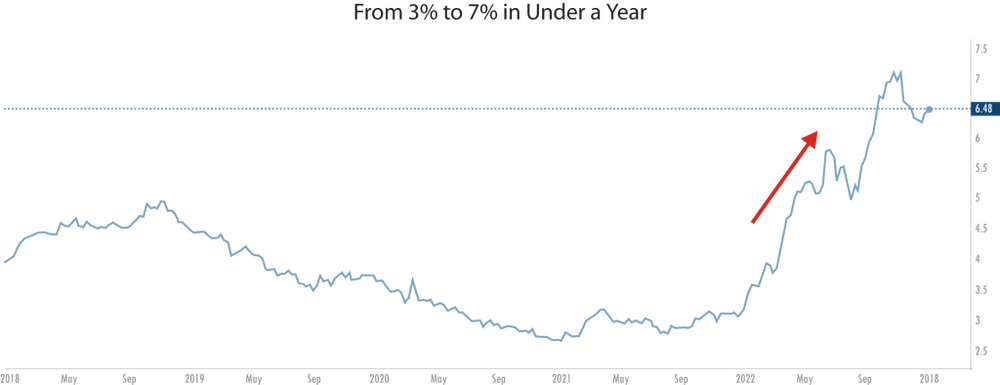
Source: TradingView
We now find ourselves in a wild-west style stand-off between buyers who can’t afford to purchase at current prices as interest rates rise and sellers who don’t want to sell at a price lower than their neighbour sold for.
So what happens next?
While I believe there is more downside in the real estate market (~10%) as a result of the higher mortgage rate environment, there are a number of reasons why that decline won’t be anywhere near as severe as the moves we witnessed in 2008.
First, chronic undersupply post the Great Financial Crisis means we are unlikely to see a glut of oversupply driving house prices materially lower. This supply/demand dynamic puts a floor on how low prices will go.
Home Construction Over the Past Two Decades
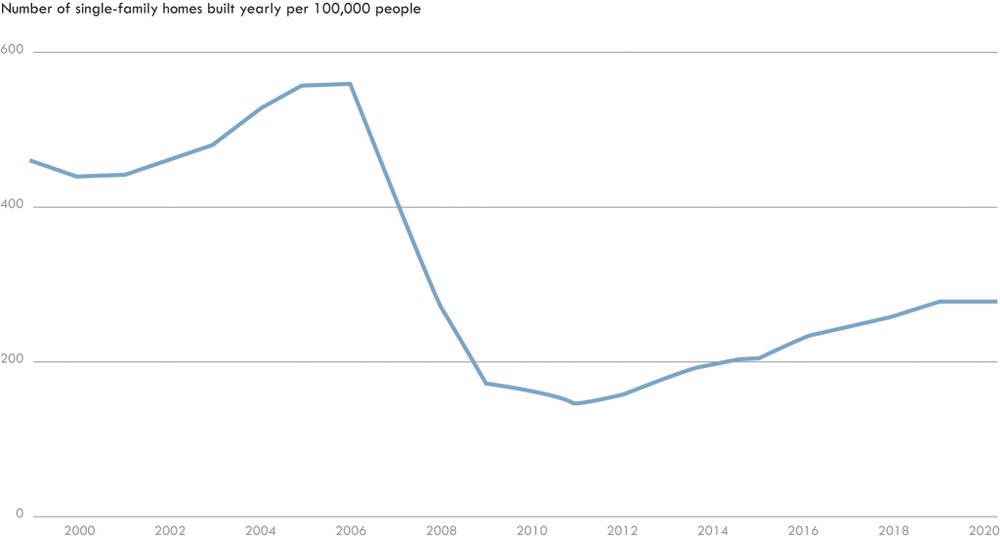
Source: US Census Bureau/USA Facts
The supply is coming back on board but not fast enough.
US Housing Starts and Permits, Monthly
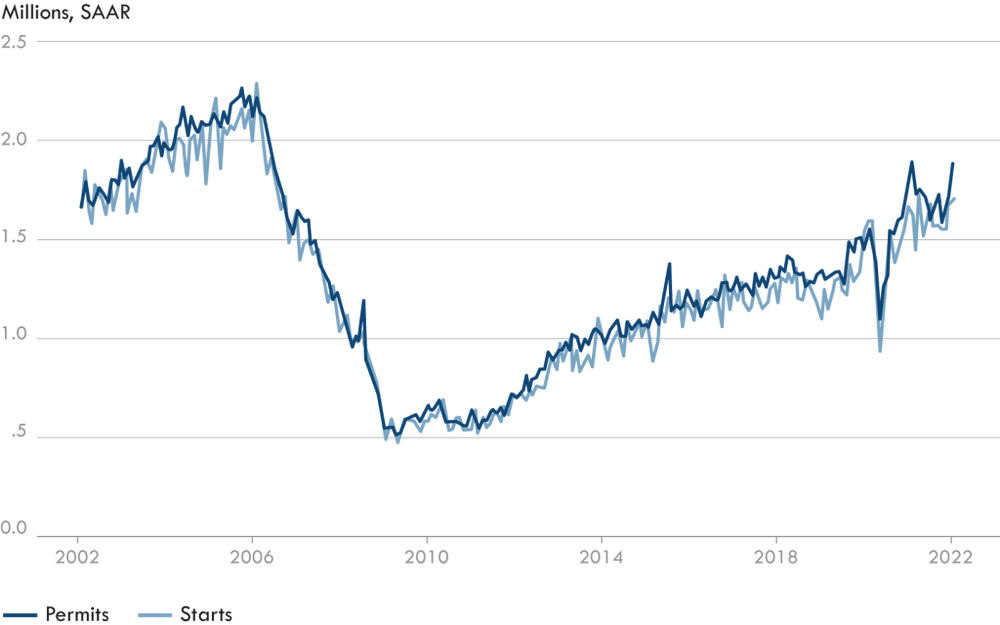
Source: Census Bureau RSM, US
Secondly, we’re not in the ‘sketchy’ loan environment we were in 2008. The health of the borrowers is still strong.
Mortgage Origination’s by Credit Score
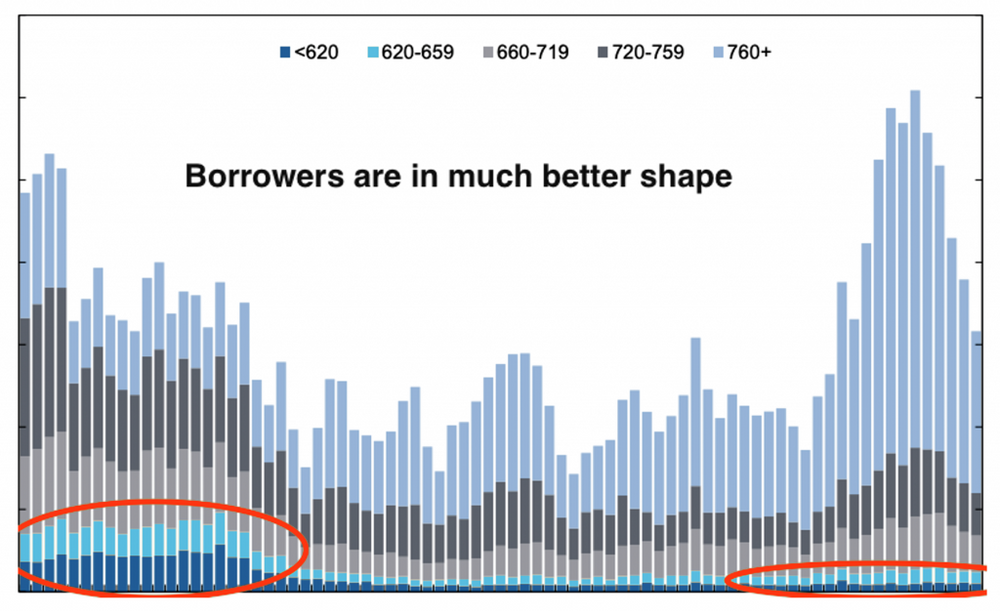
Source: New York Fed
With that, the sheer scale of the recent increase in house prices has created an equity cushion. This leaves homeowners in a healthy position from an equity-to-loan standpoint. ( the value of their original mortgage is much smaller relative to the current home price)
A 28% decline in U.S. home prices between 2006 and 2009 sent the value of some 11 million homes below their mortgage balances, triggering widespread defaults, a near-collapse of the financial system and a deep recession. Home prices would have to fall between 40% and 45% from their peak to put the same proportion of mortgaged homes underwater today, according to a CoreLogic analysis.
Finally, much of the market has locked in interest rates far below the prevailing rates.nThere are currently 2.5 million adjustable-rate mortgages, or ARMs, outstanding today, or about 9% of active mortgages. That is the lowest volume on record.
In 2007, just before the housing market crash, there were 13.1 million ARMs, representing 36% of all mortgages.
Yes, these current rates are difficult for those looking to get on the property ladder, but not everyone is playing the same game. 91% of the market has a fixed rate or no mortgage at all.
42% of U.S Homeowners have no mortgage
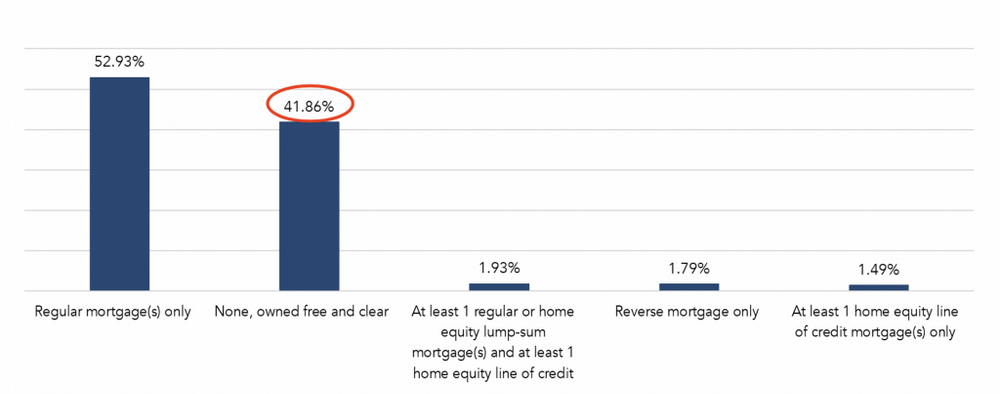
Source: AHS, First American Calculations, 2021
Questionable underwriting and variable rates issues that exacerbated the 08 crisis have been significantly reduced.
It’s clear the fundamentals are much stronger this time, but the overwhelming lack of supply remains the most supportive factor. We simply didn’t build enough homes following the last housing crash to meet the demand coming from millennial’s reaching their household formation years.
This generational under-supply means ludicrous pricing is here to stay, but the new higher rate environment will put a stop to the price surges we have experienced in recent years.
FINAL WORD
Piecing it all together, we are in for a pretty bumpy ride. The autopilot mode that worked so well for the 2010’s is well and truly behind us as increased involvement from policy makers has created an unstable and fragile ecosystem.
The last decades success with the most basic equity buy-and-hold strategy will be difficult to replicate. Going forward, we are facing a greater dispersion between winners and losers. Targeting specific sectors will be essential now that we are getting a regime change of sorts from growth and value.
With that said, the path ahead is more attractive from a valuation standpoint. Once earnings expectations are adjusted for the tougher economic landscape ahead,long term strategic opportunities will open up.
Until then, the re-emergence of fixed income as a viable option will provide downside protection while offering meaningful income for the first time in a long time.
Brighter days ahead, just not quite yet.