Market Outlook

QUICK RECAP
-
- Markets closed the books on one of the steepest September declines in two decades as historically high inflation, rising interest rates and recession fears ripped through investor sentiment.
-
- Despite a 50% recovery rally in July, equity markets ended the quarter sharply lower as the Fed reaffirmed its aggressive approach to combat inflation.
-
- Five interest rate hikes so far this year and three consecutive 75bps rate hikes have brought the Fed Funds Rate from close to zero to between 3.0% and 3.25%. This aggressive surge in interest rates has resulted in significant drawdowns across Fixed Income assets. The Global bond market has now lost over one-fifth of its value this year.
-
- This combination of rising interest rates and falling stock prices has made current market conditions particularly unbearable for investors holding a balanced portfolio. A standard 60/40 ‘balanced’ portfolio shed 20% YTD as stocks and bonds fell in unison. Only two calendar years — both during the Great Depression — have been worse.
NEW LOWS
Investing has never been easy, but current conditions feel particularly challenging.
The realization that the Fed is doing anything they can to combat 40-year-high inflation has investors worried they will push the economy over the edge and into recession.
In the first nine months of 2022, Wall Street has suffered three quarterly declines in a row, the longest losing streak for the S&P and the Nasdaq since 2008.
Losing Streak
Quarterly Returns for the S&P 500 since 1990
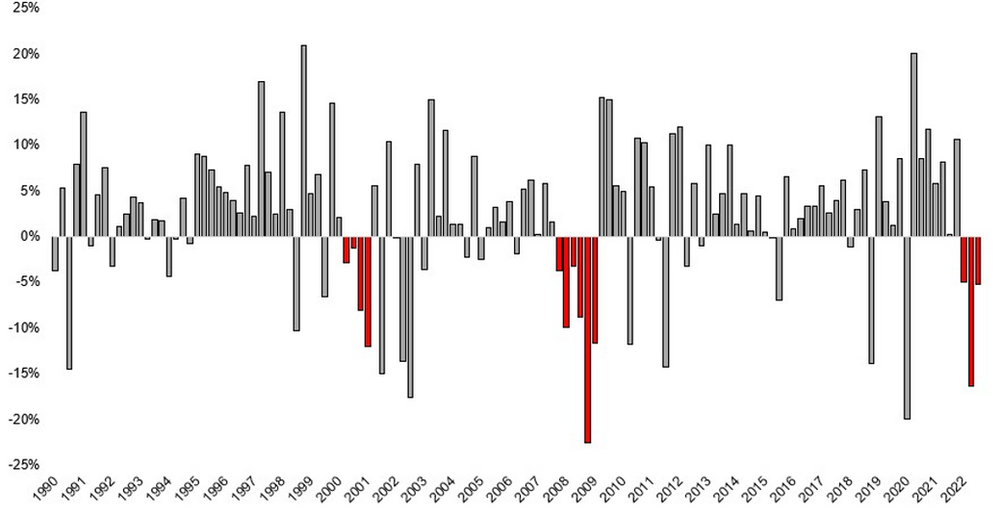
Source: Michael Batnick
Since hitting all-time highs on the very first trading day of the year, the stock market has slipped precipitously lower.
The S&P 500 fell 4.9% over the quarter and is now down 23.9% in 2022, while the tech-heavy NASDAQ has lost over 32% year-to-date.
A Bumpy Ride
S&P 500 2022 Year-to-Date Performance
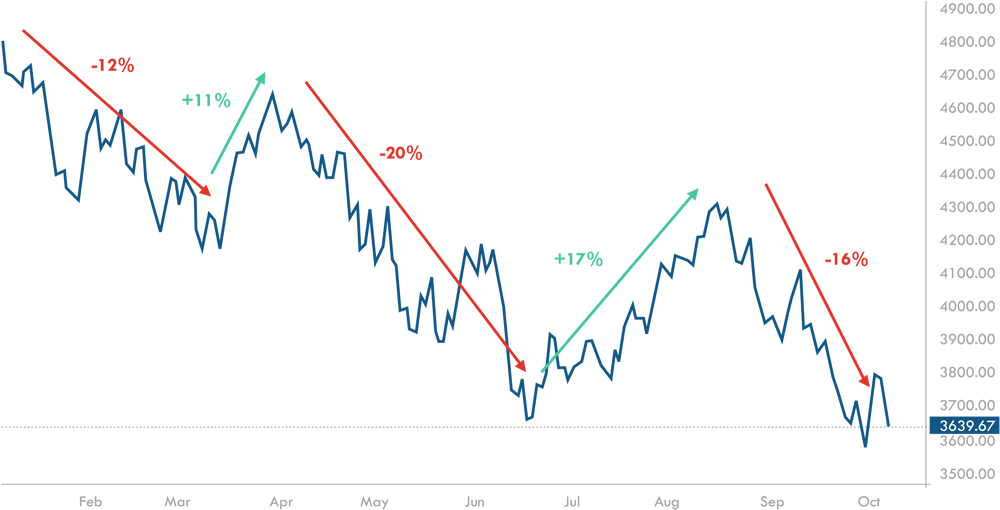
Source: TradingView
Market Snapshot
Unsurprisingly, inflationary pressures provided some positive momentum for oil and commodity prices. Elsewhere, the majority of asset classes continued to be revalued lower as interest rates surged.
The most notable performance was gold’s negative return against the backdrop of rising inflation and currency devaluation. Stuttering returns in what is arguably a gold bug’s utopian scenario has raised questions about the precious metals future as a viable inflation hedge.
Year To Date Returns of Major Asset Classes Through Sept 30, 2022
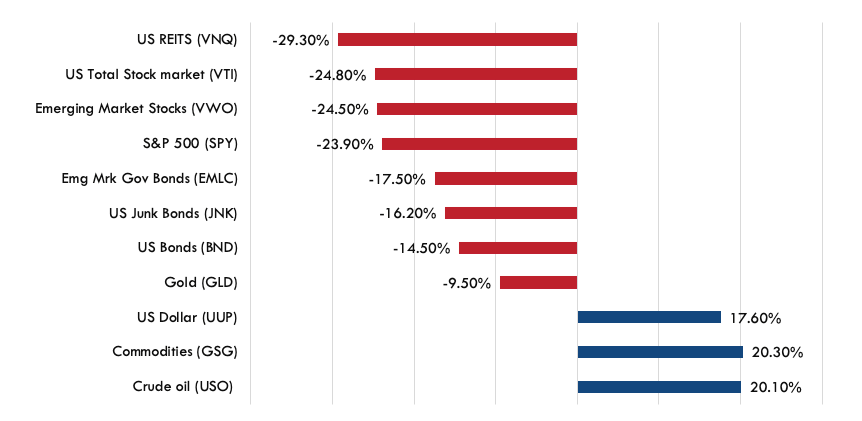
Source: Refinitiv
A Fed Mistake?
The majority of market action over the last year can be traced back to inflation and The Fed.
As inflation hit 40-year highs, the Feds primary focus shifted from reducing unemployment to cooling the economy.
Year Over Year Inflation Remains Elevated
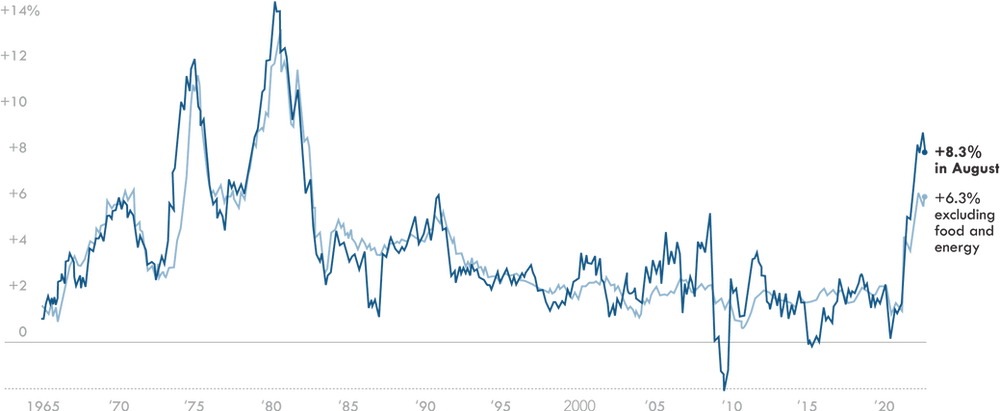
In an attempt to suppress inflation, the Fed is implementing one of the most aggressive rate hike cycles in history.
The Feds Aggressive Policy
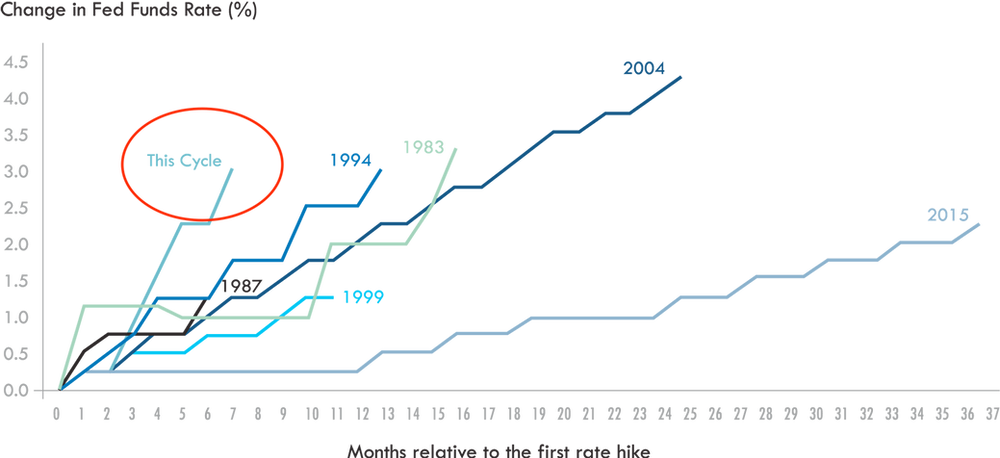
Source: Bloomberg
While rising rates are a necessary evil in the fight against inflation, the nature of the Fed response has taken market participants by surprise.
To put the velocity of this rate cycle into context, the yield on a one-year treasuries has gone from 0.07% to 4.1%. That’s a 60x jump in under a year.
1-Year Treasury Rate Skyrockets
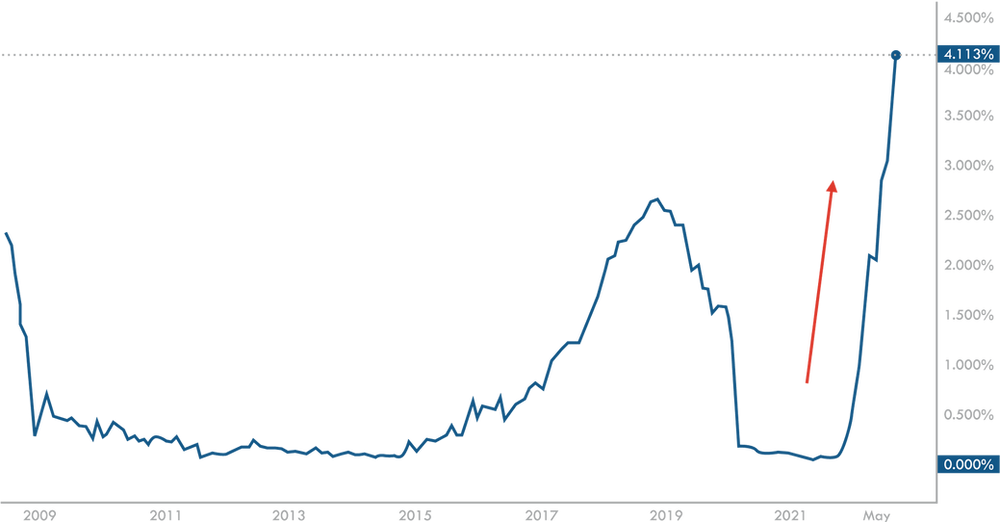
Source: TradingView
Undeniably, the continuation of QE and the Feds MBS purchasing program in 2021 despite the emergency of a red-hot stock and house market resulted in over-stimulus of asset prices.
They now appear to be overcompensating for their initial inaction. This leaves them wielding a wrecking ball. The Fed easily could have moved earlier and more methodically. Instead, they’re now swinging wildly and things could start to break.
THE INTEREST RATE CONUNDRUM
Where do interest rates go from here? That’s the Trillion-dollar question.
Markets are flooded with investors making predictions about where interest rates will be in a year from now but trying to decipher any relevant future insight from the Fed’s messaging or their forecasts is redundant.
These forecasts tend to fluctuate dramatically over time.
In June 2021, as the economy showed significant signs of recovery, the Fed was still pricing in 0% rates through the end of 2022 with a 50bp rate hike in 2023.
Instead of sitting at 0% as forecast, the Fed Funds Rate is now at 3.25%.
Not even close.
As inflation and economic data adjust, so too will the Fed’s rate predictions.
So instead of dissecting every Fed speech or taking their forecasts as gospel, we need to analyze the data to determine their next move.
Ultimately the Fed will continue to raise rates until core inflation moves significantly closer to their target rate of 2%.
On the supply side, inflation pressures have continued to moderate. Lumber prices and Shipping costs which functioned as the original supply-side inflation gauge, continue to fall. Lumber is now at pre-pandemic levels, while the cost to send a 40-ft container from Shanghai to Los Angeles has fallen by 74% from its peak and is back to August 2020 levels.
Elsewhere, the Food and Agriculture Organisation’s world food price index dropped to its lowest level since the start of the war in Ukraine, and crude oil prices have dropped nearly 30% in Q3.
These are all positive markers in the fight against inflation. Still, in a demand-driven economy, we will need to see signs of a reduction in spending and economic activity before the interest rate hiking cycle is halted.
We are caught in a classic case of ‘bad news is good news’ for the foreseeable future. In a world where the Fed is actively trying to cool the economy, they will need to see signs of pain from businesses and consumers before they stop swinging their wrecking ball in the fight against inflation.
Despite the deterioration of consumer and business sentiment indicators, demand has proven resilient, and spending has continued unabated in recent months.
But we are now starting to see undeniable evidence of an economic slowdown.
PMI
The ISM’s manufacturing PMI dropped to 50.9 this month, the lowest reading since May 2020. This suggests companies are adjusting to future lower demand as new orders contract.
Housing
Higher mortgage rates are already being felt across the residential housing market. The national association of realtors reported a 19.9% drop in year-over-year home sales in August.
Existing Home Sales (SAAR)
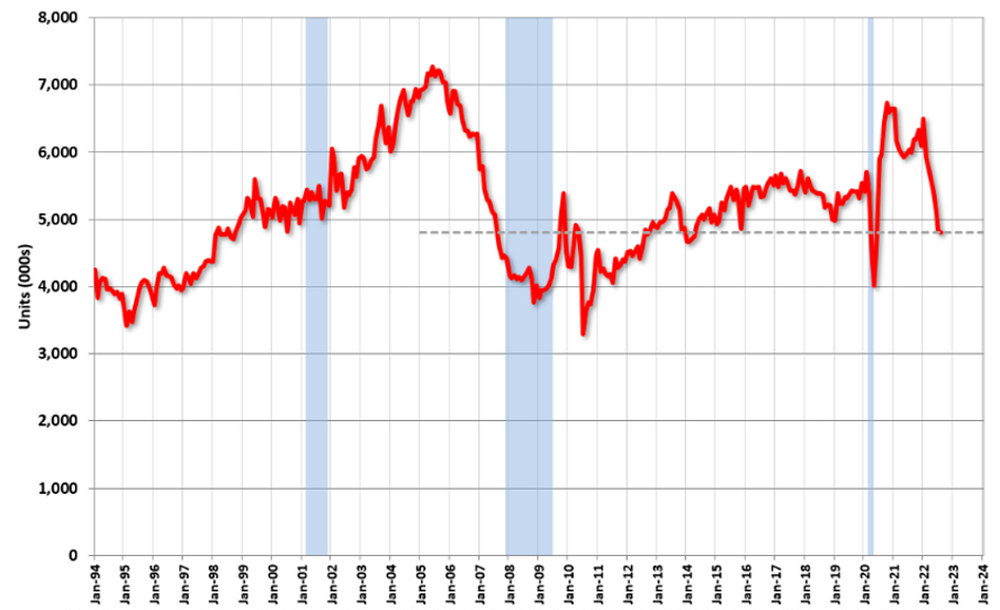
Source: National Association of Realtors
While we have only seen marginal adjustments to house prices, this will start to take effect over the coming months as higher interest rates for longer makes housing unaffordable at current prices.
With mortgage rates jumping from 3% to 7% in under a year, the numbers no longer add up.
Those looking to pay $2,500 on monthly mortgage payments with a 20% down payment can afford a $476K house today. In early 2021, the figure was $759K.
The Impact of Higher Mortgage Rates and House Prices
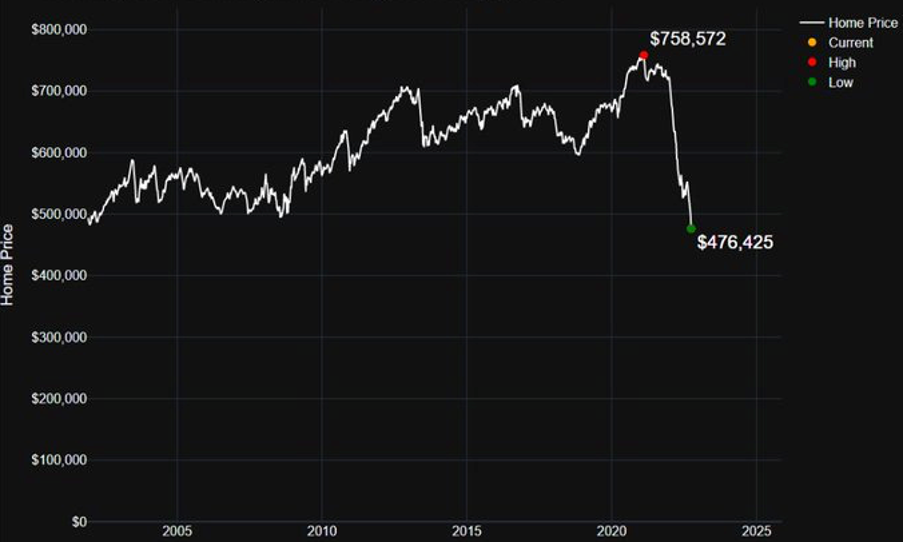
Source: Liz Ann Sonders/Bloomberg
While a lack of supply and creditworthy borrowers will provide a floor under how far house prices will fall ( I believe it to be in the 10% range), this real estate slowdown will permeate into the broader economy. It affects everything from sentiment to spending power as higher mortgage repayments leave less room for spending elsewhere.
Labour Market
The labour market resilience despite months of tighter financial conditions has shouldered much of the blame for the Fed’s aggressive stance.
Just this week, the Labor Department reported the unemployment rate fell to 3.5% in September, lower than expectations of 3.7%. While the labour market did slow down based on payroll data and new job openings, the Fed are likely to keep hiking until they see a more notable pull back in the labour market.
To quote Fed Chair Jerome Powell,
“Job openings could come down significantly, and they need to.”
Morally this approach may seem questionable, but it may be a necessary evil. The tight labour market is generating substantial household income gains, with wage and salary income rising by USD 1.04 trillion (or 10.0%) in the year ending in July (a combination of both higher salaries and higher employment numbers overall). Unless this slows, demand and inflation will persist.
To be clear, we don’t need the inflation rate to drop to 2% before interest rates level off and markets move higher. Rather, we just need irrefutable evidence that things are moving in the ‘right direction’, and we are starting to see that.
Long term bullish
The bad news is everywhere at the moment.
Inflation remains persistent; interest rates look set to increase further; war in Europe and an emerging energy crisis have all created a mountain of economic pressure that is impossible to ignore.
It’s difficult not to panic when the warning signs are flashing red, but there are several reasons to be long-term bullish right now.
1. Much has already been priced in
Whether the economic outlook is good or bad is never the question we are trying to answer as investors.
The only question that matters is how much of this negative news is already priced into the market.
The chart below from JP Morgan shows the past seven recessions where there was at least a -20% drawdown in the S&P 500.
This shows the average drawdown of the last 7 recessions was 37%.
Previous Recessions
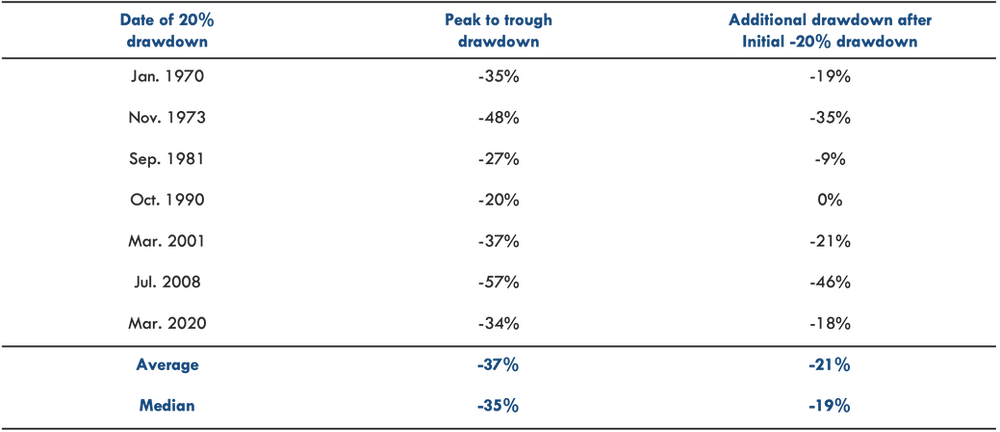
Source: JP Morgan
This would suggest that, on average, 2/3rds of the potential losses have already been accounted for.
But, of course, not all recessions are created equal.
Historically, there has been a big difference between the experiences during a mild recession vs. a “crises” recession.
So now the question becomes, are we heading for a ‘mild’ or ‘crisis’ recession?
The jury is still out. If inflation refuses to budge, then tighter financial conditions will create a deeper recession.
While this is possible, it is not my base-case scenario. The Consumer remains more resilient from a leverage, employment, and savings position relative to previous recessions.
Inflation will not rapidly adjust overnight, but the tighter conditions being created by the Fed will ensure inflation numbers trend downward over time.
With the S&P 500 currently down 23% YTD, it appears that a mild recession and then some has already been priced into markets.
2. Keep A long Term Perspective
Regardless of what level of recession we experience, when you extend the time horizon out to even just one year, the future S&P 500 returns following an initial -20% drawdowns becomes compelling.
The chart below shows average one-year and three-year returns following the initial -20% drawdown in recessions.
Returns After A Drawdown
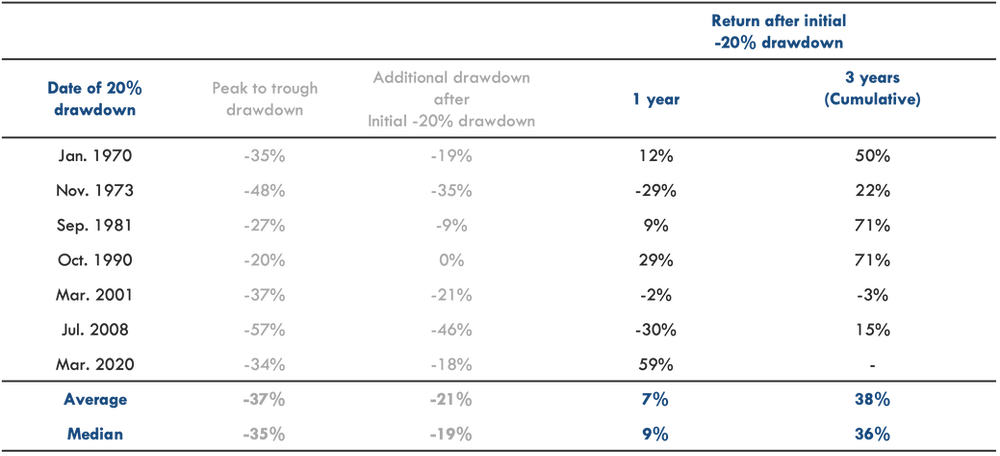
Source: JP Morgan
Remember, these are seven instances where a recession actually happened. Recession is not a guarantee today.
You’ll never time the markets perfectly and short-term risks remain, but the long-term potential returns have improved, regardless of whether or not you perfectly time the bottom.
3. Multiple Improvement
Valuations have dropped by over 20% but earnings growth remains positive, which has resulted in a significant improvement in valuation metrics.
The forward 12-month P/E ratio for the S&P 500 has gone from 21 to 15.6. This P/E ratio is now below the 10-year average of 17.0.
S&P 500 Change in Forward 12-Month EPS vs. Change in Price
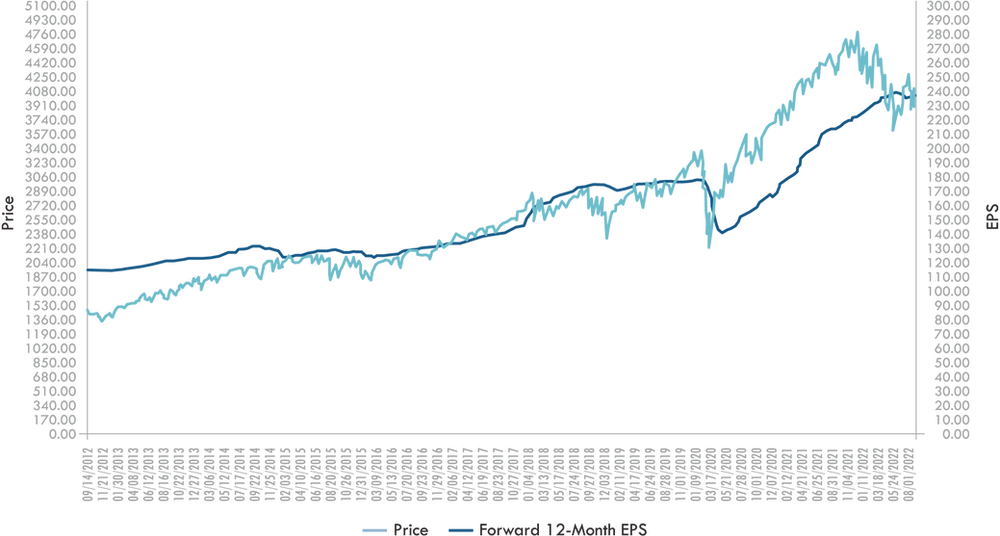
While these valuations are based on current earnings consensus forecasts, recent price correction still create a much more intriguing entry point for investors.
4. Peak Bearishness
Timing the market is not about selling when we see peak bearish economic outlook in the market. It’s literally about the opposite.
The AAII sentiment poll, which shows average investor outlook, hit 60% Bears last week. That is to say, 60% of investors expect markets to get worse.
Rationally this makes sense as the economic outlook worsens. It’s hard to remain bullish as negative news floods in.
But history shows the more pessimistic the investor class becomes, the better the prospective returns look six months out.
% of Investors with a Negative Near-Term Outlook
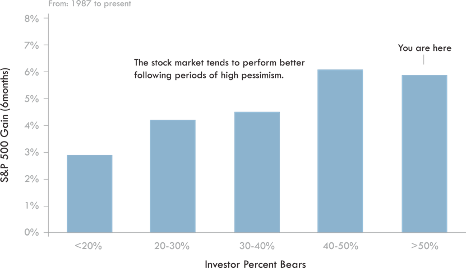
Source:Chartoftheweek
‘The highest percentage of AAII bearish sentiment was 70% and occurred on March 5, 2009 near the end of the financial crisis bear market’.
‘The lowest percentage of AAII bears was 6% on August 21, 1987 shortly before the stock market crash of October 1987’.
Selling as things appear to reach levels of apocalyptic misery seems like the rational thing to do, but the data shows the opposite.
FINAL WORD
As we move forward, the Fed will continue to prioritise the fight against inflation over supporting growth until we see substantial evidence that inflation is trending lower.
This tighter financial environment should slow the global economy while some economies could enter a recession.
The magnitude of this potential recession will depend on multiple factors such as interest rate levels, energy crisis management and policy support.
But it’s not all bad news.
-
- Company earnings have held up well
-
- Labour markets are moderating but remain strong
-
- Supply-side inflation pressures have eased
-
- Interest rates hikes are likely to slow following the FOMC meeting next month
-
- This year’s pullback has stripped much of the excess out of markets
For stocks, the growth outlook remains challenging, but much of the negative news has now been priced in. Volatility is likely to persist over the short term, but current prices are compelling for those looking to build out long-term positions.
For the first time in a long time, bonds are attractive, with a significant amount of further tightening already priced in. Short-term government bonds today yield what junk bonds yielded a year ago. Although yields are still well below the current rate of inflation, as inflation reverts, investors will be able to add yield to their portfolio in a way that simply hasn’t been possible in well over a decade.
So, after a very difficult year so far for both stocks and bonds, valuations are now more attractive than they have been in quite some time.
I, for one, am long-term bullish on the stock market. There will always be reasons not to invest but those looking to build out their long term positions need to find their way through the noise and realise the opportunity that these new valuations represent.